Reporting
The Reporting Center in Check empowers users to build, schedule, and manage custom reports derived from various dashboards. This module supports data-driven decision-making by enabling in-depth reporting on credit performance, operational efficiency, and analyst productivity. Reports can be configured with multiple filters, exported in various formats, and shared with relevant stakeholders.
Report Builder
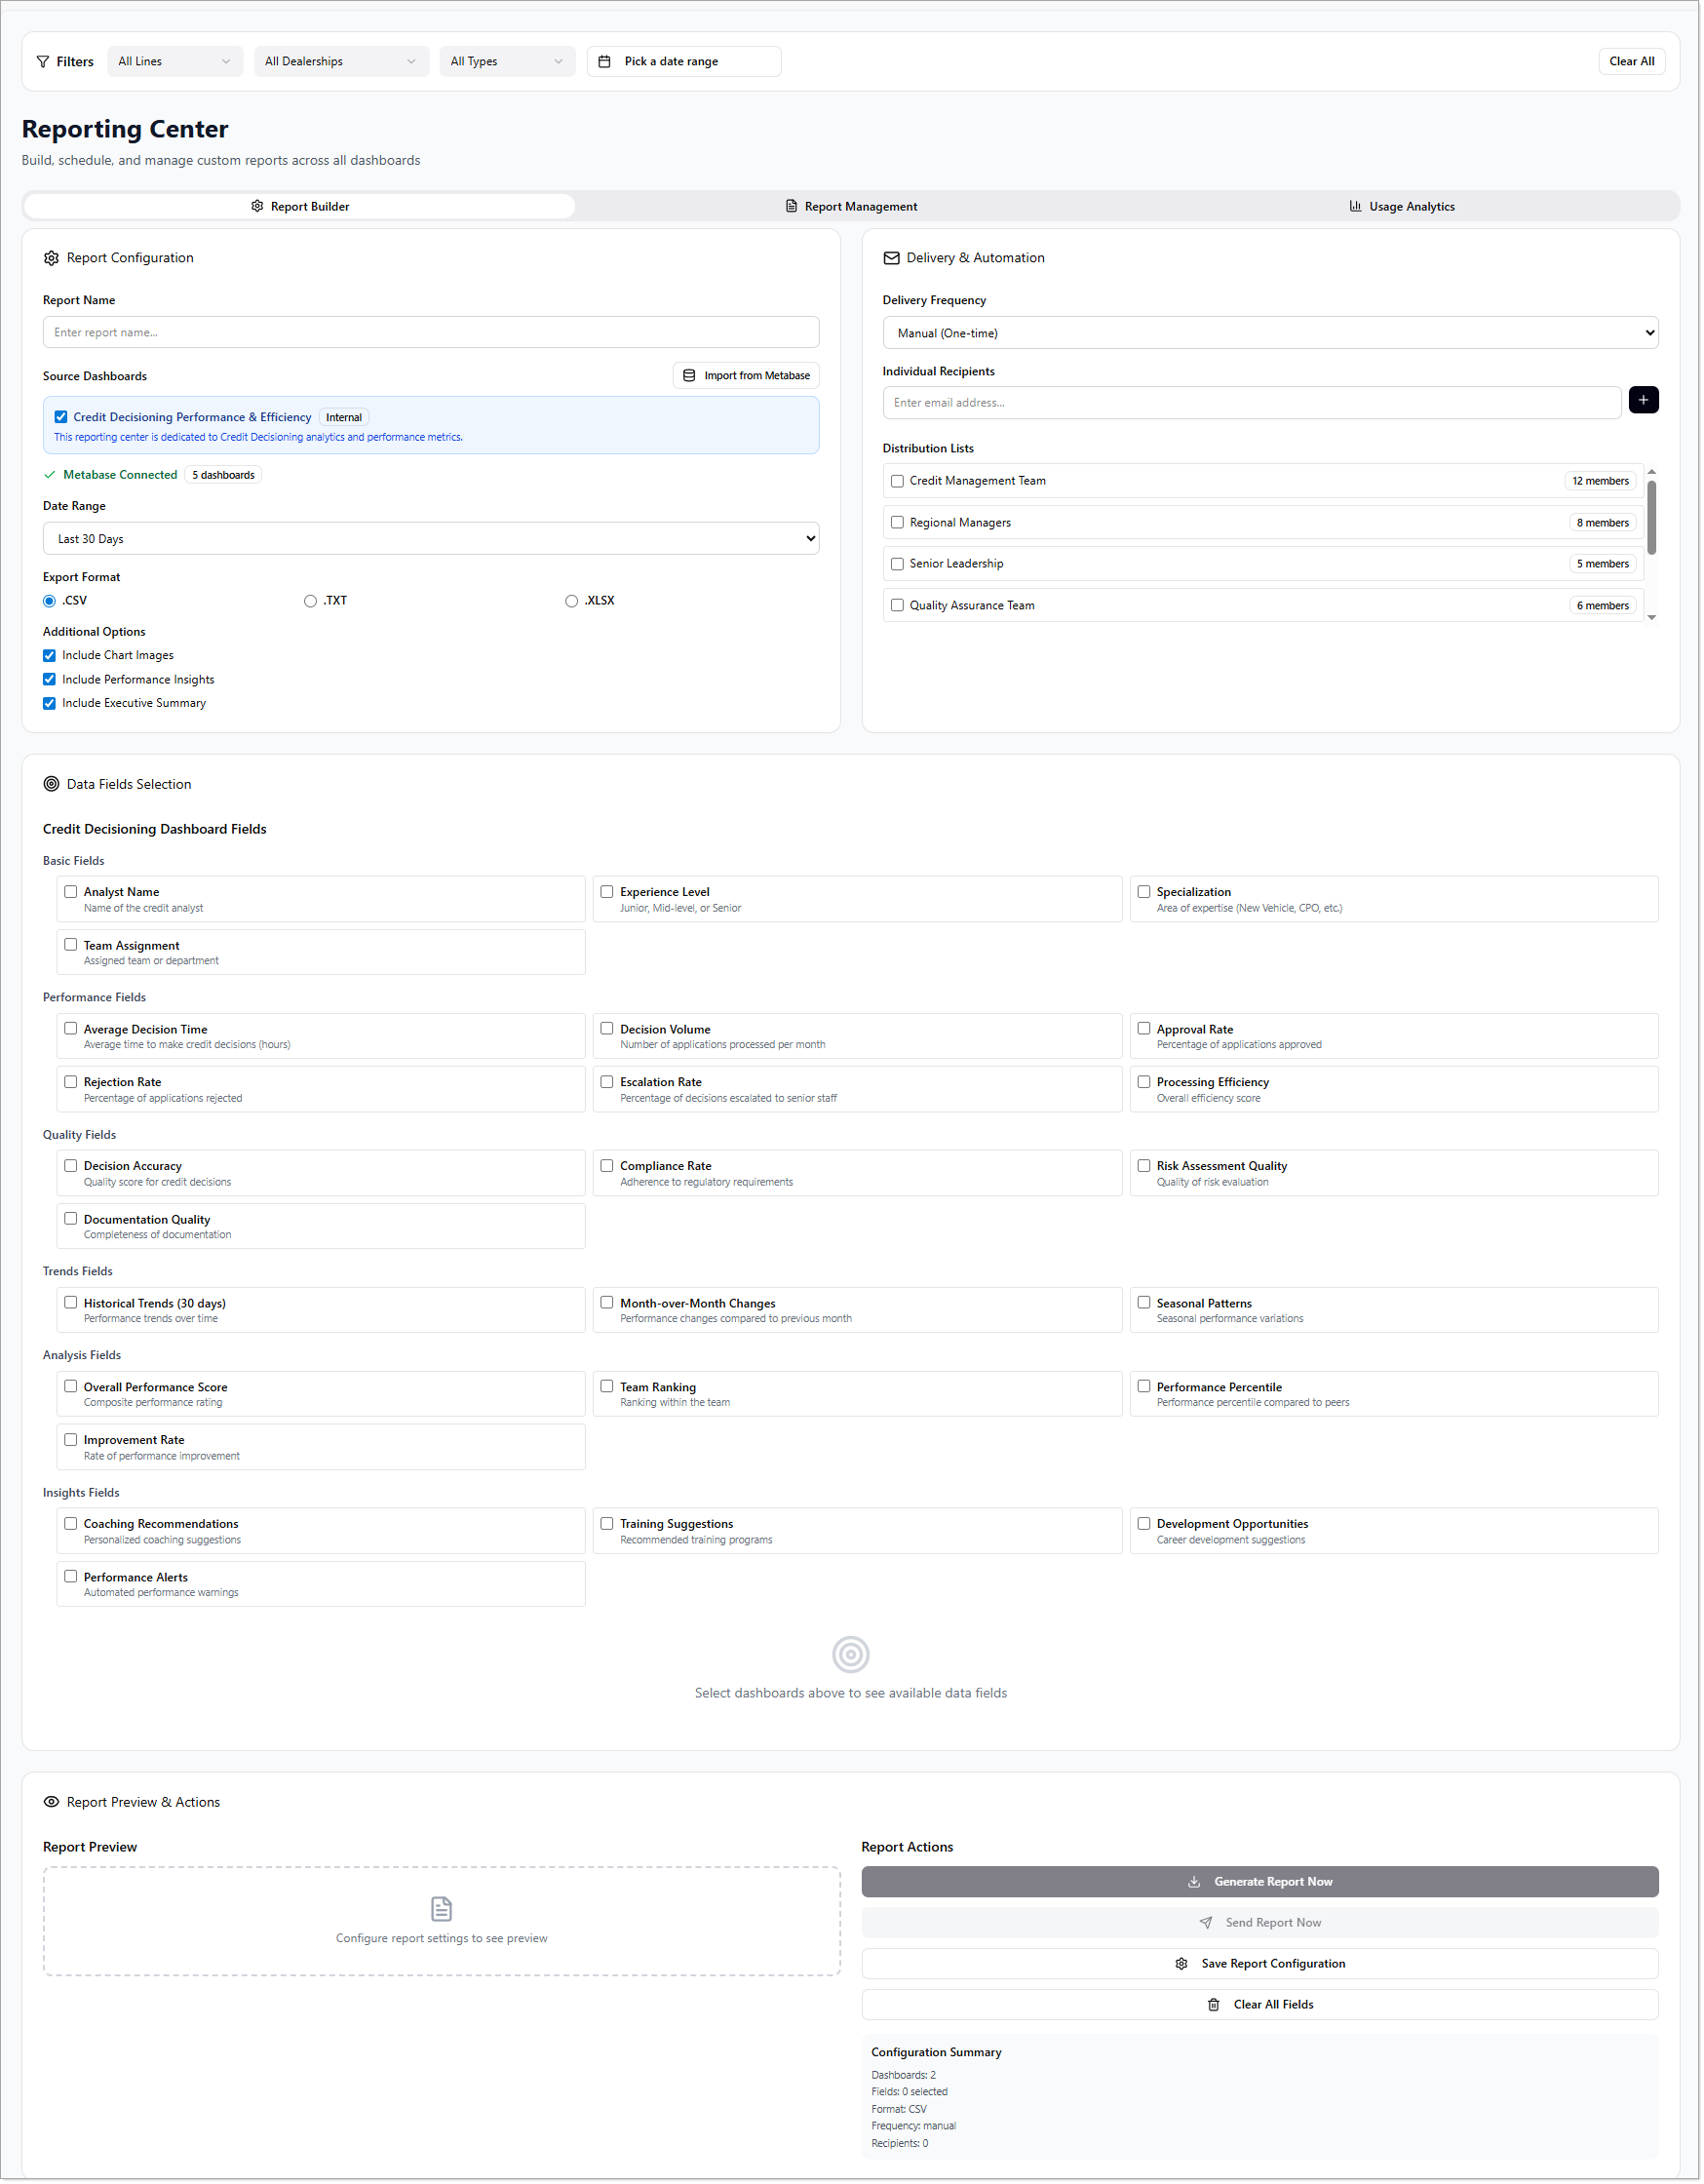
The Report Builder offers a step-by-step interface to configure and generate customized reports from one or more dashboards. It includes several configuration areas to tailor the report content according to business needs.
Report Configuration
Users can define core settings for each report by providing the following:
-
Report Name – A unique title for the report.
-
Source Dashboards – Select dashboards to pull data from (e.g., imported from Metabase).
-
Date Range – Choose predefined date filters such as Last 30 Days, Last 90 Days, Quarter, etc.
-
Export Format – Choose output formats such as
.CSV,.TXT, or.XLSX. -
Additional Options – Optional checkboxes for:
- Include Chart Images
- Include Performance Insights
- Include Executive Summary
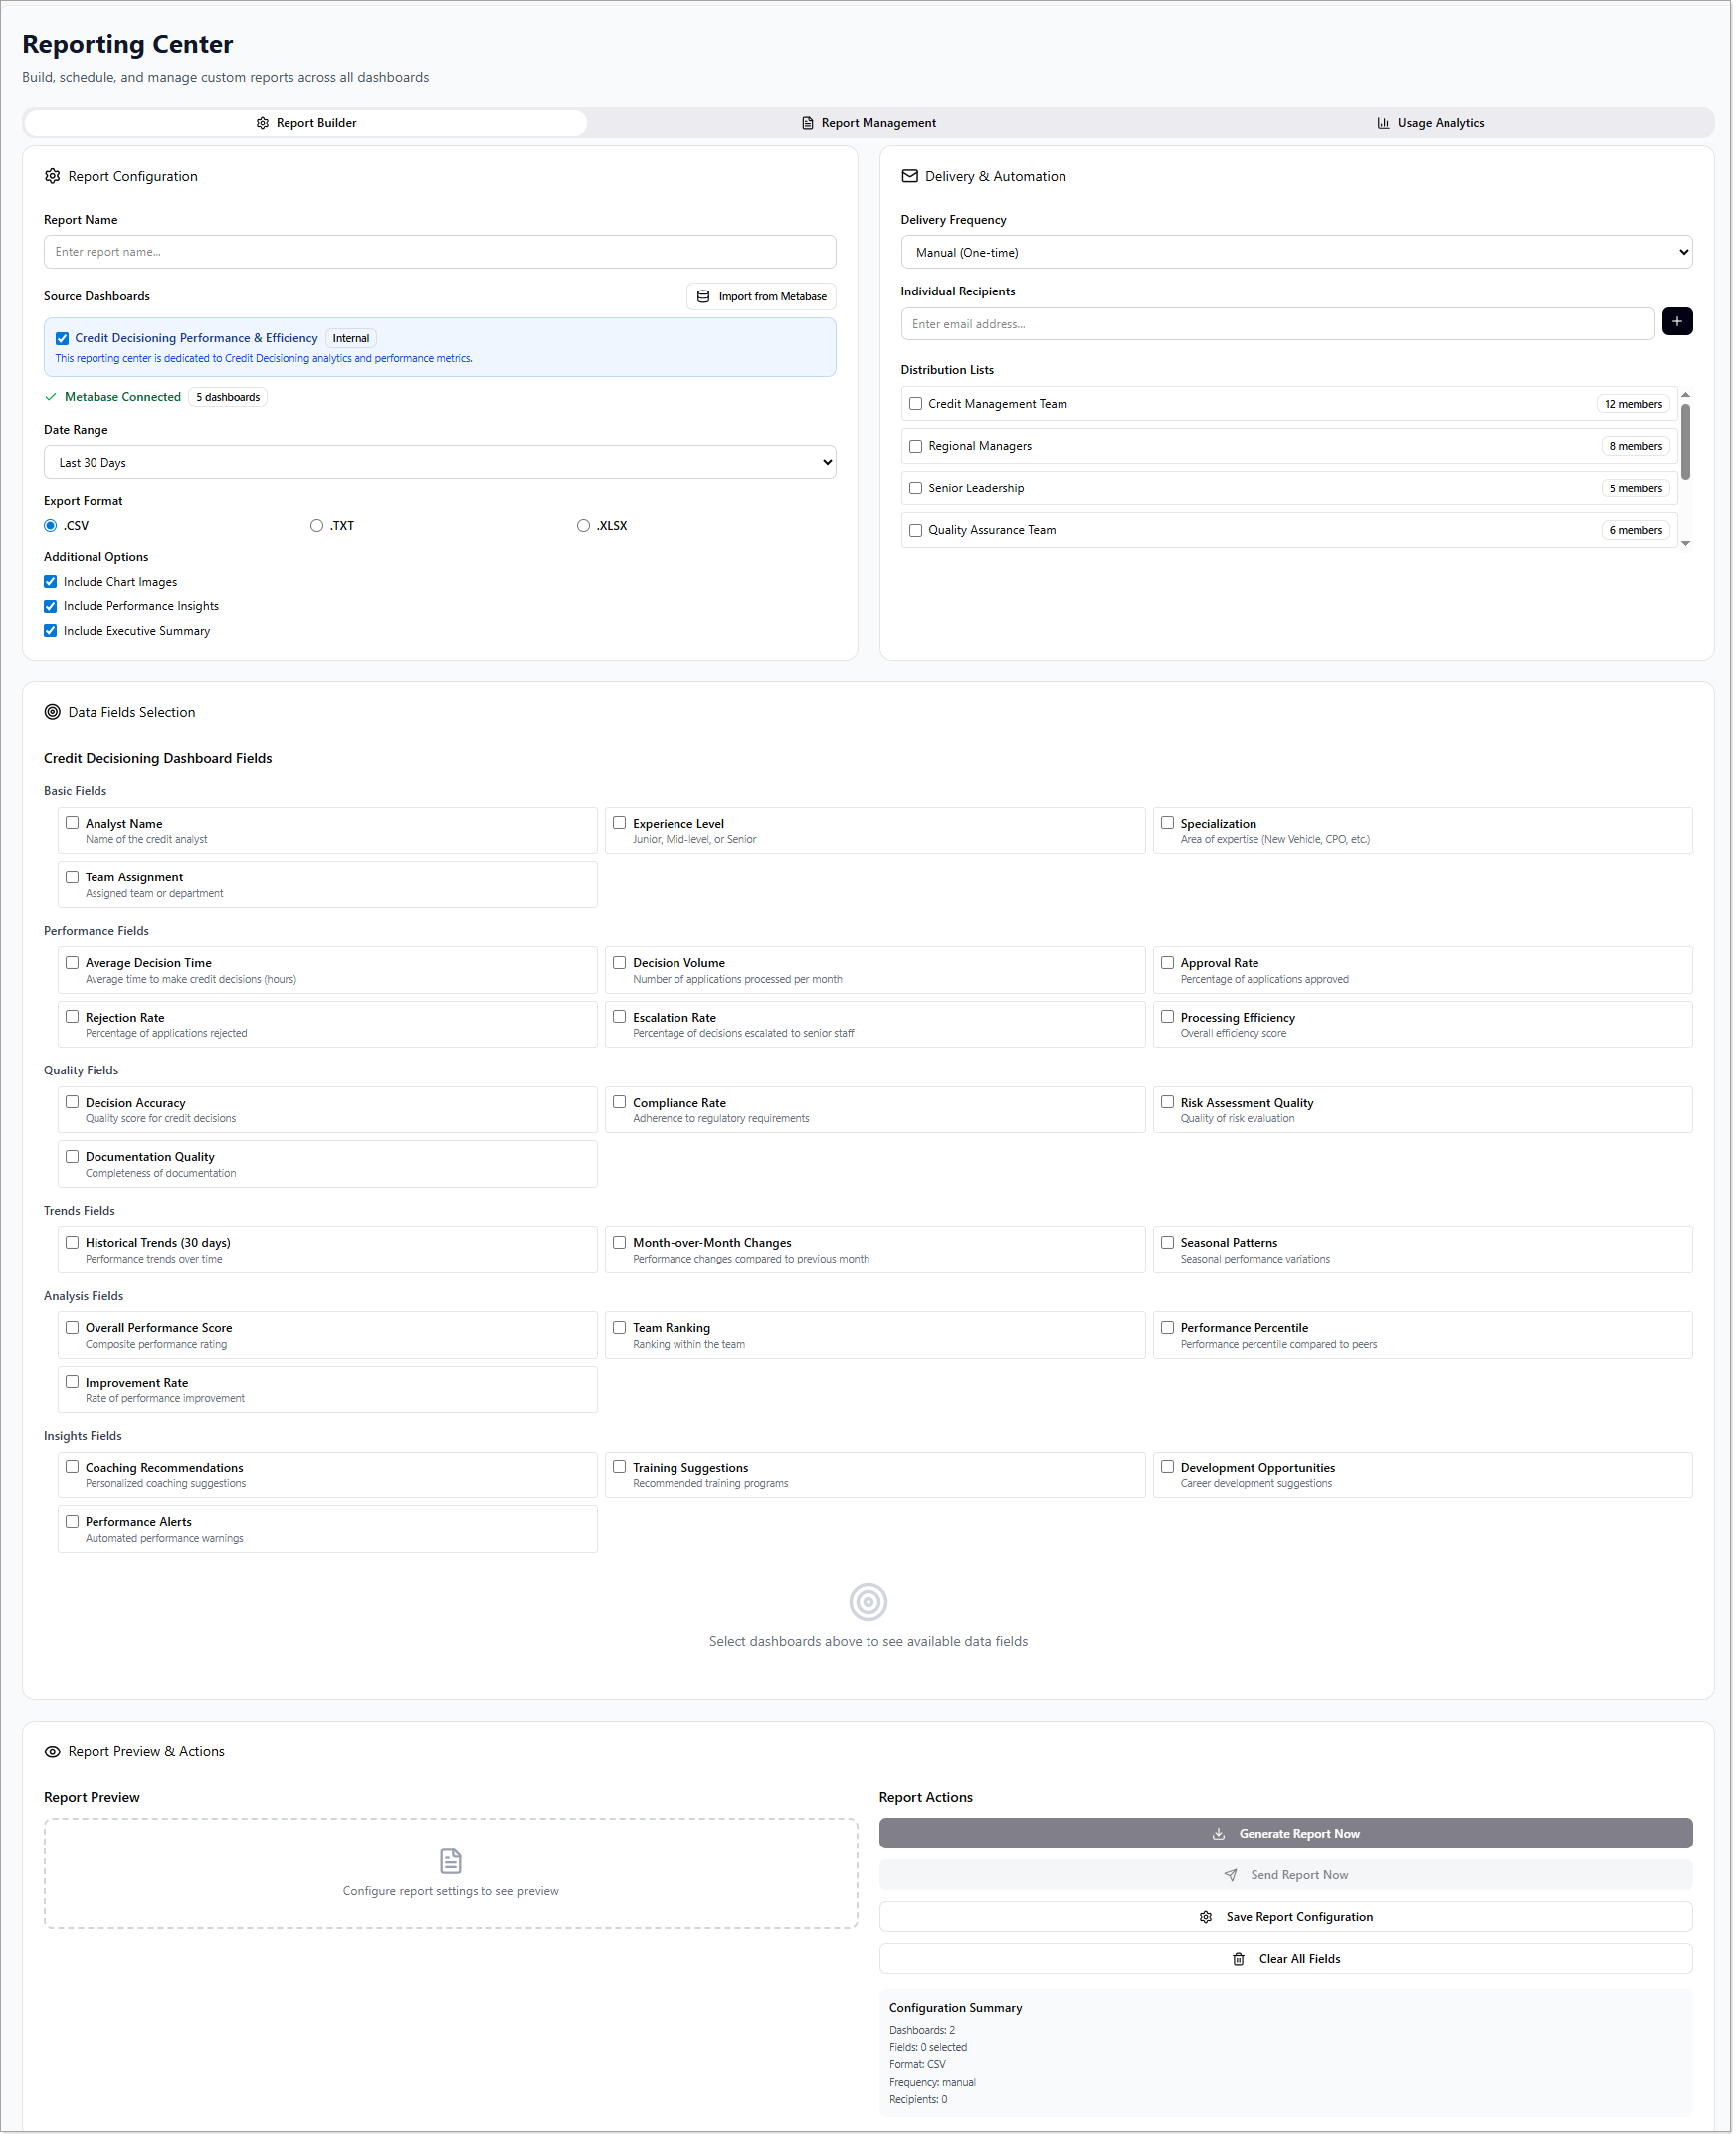
Data Fields Selection
Within the Credit Decisioning Dashboard Fields, users can select specific metrics and dimensions across several categories:
1. Basic Fields
- Analyst Name – Displays the name of the credit analyst.
- Experience Level – Junior, Mid-level, or Senior classification.
- Specialization – Analyst’s expertise area (e.g., New Vehicle, CPO).
- Team Assignment – Assigned team or department.
2. Performance Fields
- Average Decision Time – Average time to reach credit decisions.
- Decision Volume – Monthly application processing volume.
- Approval Rate – Percentage of approved applications.
- Rejection Rate – Percentage of rejected applications.
- Escalation Rate – Rate of decisions escalated for senior review.
- Processing Efficiency – Aggregate efficiency score.
3. Quality Fields
- Decision Accuracy – Score measuring accuracy of credit decisions.
- Compliance Rate – Degree of regulatory adherence.
- Risk Assessment Quality – Accuracy of risk evaluations.
- Documentation Quality – Completeness and correctness of submitted documents.
4. Trends Fields
- Historical Trends (30 Days) – Shows changes over the last month.
- Month-over-Month Changes – Comparisons to previous month’s performance.
- Seasonal Patterns – Detects seasonal variations in performance.
5. Analysis Fields
- Overall Performance Score – Composite score for analyst effectiveness.
- Team Ranking – Analyst’s rank within their team.
- Performance Percentile – Comparative percentile across peers.
- Improvement Rate – Rate of ongoing performance improvement.
6. Insights Fields
- Coaching Recommendations – Suggested areas for coaching.
- Training Suggestions – Recommended training programs.
- Development Opportunities – Career growth suggestions.
- Performance Alerts – Flags for low or inconsistent performance.
Report Preview & Actions
Preview
Users can preview the generated report layout and content before finalizing it. This helps in validating the selected fields and configuration.
Actions
- Generate Report Now – Instantly generate the report.
- Send Report Now – Email the report to designated recipients.
- Save Report Configuration – Save the current setup for future use.
- Clear All Fields – Reset all selections and configurations.
Report Management
The Report Management section allows users to view, organize, and update saved reports and scheduled deliveries.
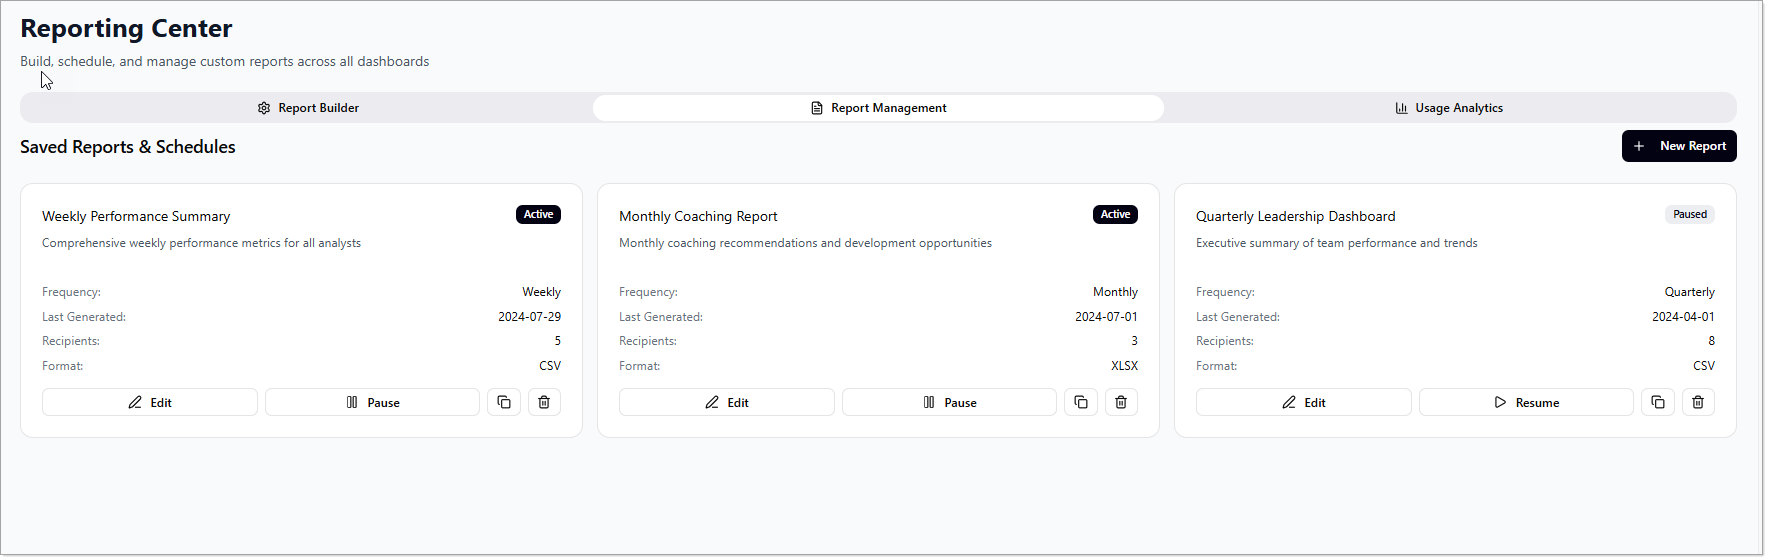
Features
- View Saved Reports – Access all previously created reports.
- View Schedules – See active and paused schedules with status indicators.
Actions Available
- New Report – Click to open the Report Builder and start a new report.
- Edit – Modify an existing report’s configuration.
- Pause – Temporarily suspend report scheduling.
- Resume – Reactivate a paused schedule.
- Duplicate – Clone an existing report for minor adjustments.
- Delete – Permanently remove a report from the system.
Usage Analytics
This section offers visibility into how the reporting feature is being used across the organization.
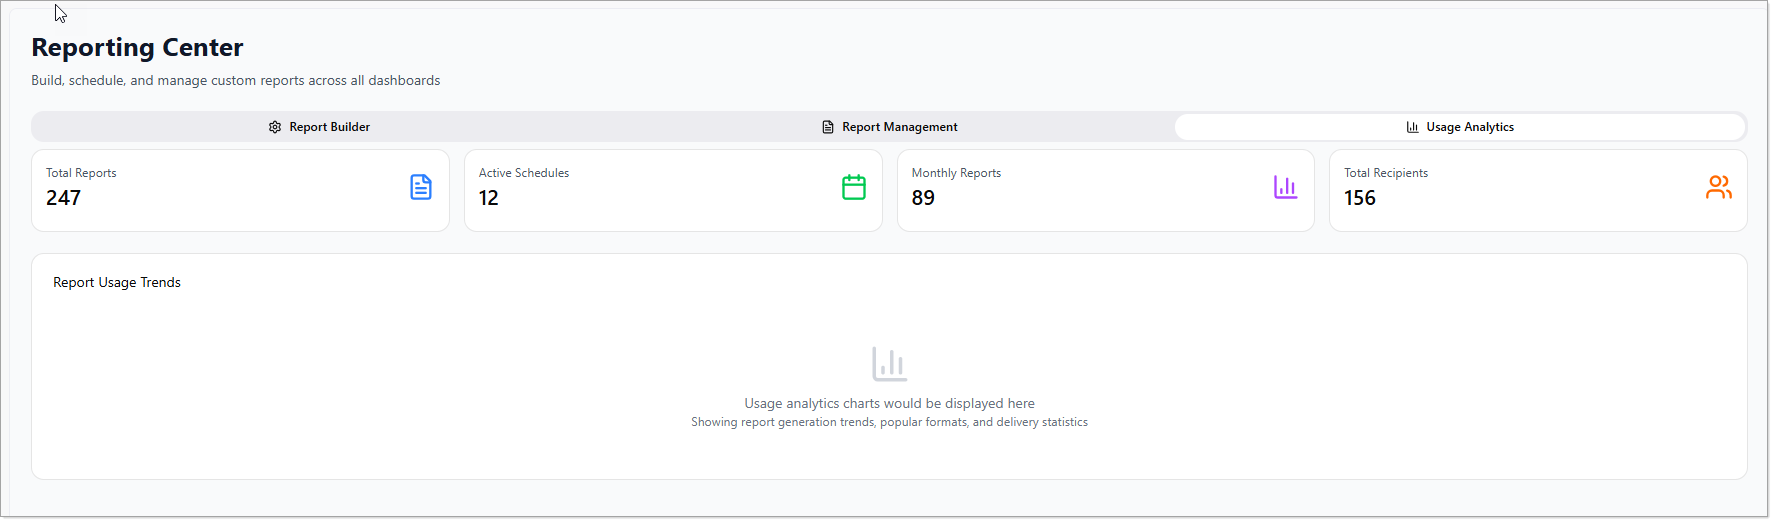
Metrics Displayed
- Total Reports – Cumulative count of all reports generated.
- Active Schedules – Number of currently running schedules.
- Monthly Reports – Number of reports generated this month.
- Total Recipients – Unique recipients across all report distributions.
- Report Usage Trends – Visual trends of reporting activity over time.